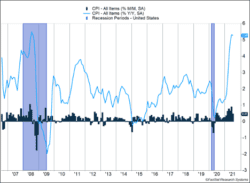
Core inflation moderated significantly last month, rising only 0.3% after jumping 0.9% in June. Used vehicle prices, which rose 10.2% in June, increased only 0.2% in July. Core CPI excludes food and energy prices, which rose 0.7% and 1.5% respectively. Those two categories propelled overall inflation 0.5% higher, down from 0.9% last month.
Key Points for the Week
- U.S. core inflation increased only 0.3% last month, suggesting the inflation surge may be losing steam.
- Job openings topped 10 million, fueled by continued demand in leisure and hospitality, retail and professional, and business services.
- Second quarter earnings grew 89.3% last quarter as 89% of S&P 500 companies beat analyst estimates.
Job openings surpassed 10 million for the first time and have climbed by more than 2.5 million in the last four months. Hiring was strong in July, but not enough to keep up with increasing demand for workers.
S&P 500 earnings grew 89.3% in the second quarter compared to one year ago. Big gains in industrials and consumer discretionary stocks supported high growth compared to the same quarter a year ago, when much of the country experienced a lockdown.
Markets generally reacted positively to the news. The S&P 500 gained 0.8%. The global MSCI ACWI rose 0.7%. The Bloomberg BarCap Aggregate Bond Index added 0.1%. Retail sales in the U.S. and China lead the list of economic data this week.
Figure 1
Inflationary Trends Moderate
Transitory may be the word of the year. Webster defines it as “of brief duration: temporary,” and the July inflation report suggested our bout with inflation may prove transitory as Federal Reserve Chair Jerome Powell suggested. Overall inflation growth was 0.5%. Core inflation rose 0.3%, just above the monthly pace associated with the Fed’s inflation target.
The 0.3% increase was much lower than the 0.9% increase the month before. Prices for items related to mobility increased at a much slower rate in July than June. Used car prices increased only 0.2% after rising more than 10.2% the previous month. New car prices still rose 1.7%, but that was a dip from a 2.0% gain the previous month. Lodging prices rose 6.8% last month while rental car prices dropped 4.6%.
Our expectation remains that U.S. inflation will revert to 2-3% as some of the demand shocks work their way through the system. Before used car prices jumped so rapidly, lumber prices were getting most of the attention. High prices attract additional supply, and lumber prices have since retreated more than 70% from their peak. The same type of decline in used car prices seems unlikely, but rapid price gains seem less likely in coming months.
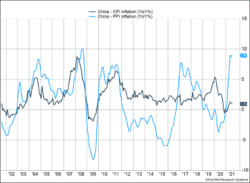
Chinese inflation, both for consumers and producers, also serves as an indicator of global inflation pressure. The Chinese economy has been growing faster than the U.S. for years, and inflationary pressures seem likely to show up in both Chinese and U.S. data. Chinese consumer inflation is very low. Consumer prices have only increased 1.0% in the last year and haven’t experienced the same shock as the U.S. One reason is Chinese food prices have fallen significantly. Pork prices have fallen 43.5% during the last year, and pork is a staple for many Chinese people (Figure 2).
Chinese producer prices tell a different story as they have increased 9.0% over the last year. While 0.2% higher than last month, the sharp acceleration shown in Figure 2 seems to be slowing as well.
Figure 2
Labor costs are the biggest threat to our benign inflation outlook. The U.S. has more than 10 million positions available for hire. Some firms are raising wages quickly to attract or retain workers. The demand for labor has led more people to have the confidence to quit their jobs. Quits remain at high levels as demand in certain industries is outstripping supply.
Even if wage increases push inflation somewhat higher, the possibility of a return to 1970s-style inflation seems very remote. Given the moderating prices in some key industries, the odds of breakout inflation continue to ebb. Today’s economy is more competitive and less energy-dependent than in the 1970s. More likely is an environment in which inflation runs above 2%, driven by faster wage growth to lure people back to the job market and retain existing staff.
—
This newsletter was written and produced by CWM, LLC. Content in this material is for general information only and not intended to provide specific advice or recommendations for any individual. All performance referenced is historical and is no guarantee of future results. All indices are unmanaged and may not be invested into directly. The views stated in this letter are not necessarily the opinion of any other named entity and should not be construed directly or indirectly as an offer to buy or sell any securities mentioned herein. Due to volatility within the markets mentioned, opinions are subject to change without notice. Information is based on sources believed to be reliable; however, their accuracy or completeness cannot be guaranteed. Past performance does not guarantee future results.
S&P 500 INDEX
The Standard & Poor’s 500 Index is a capitalization-weighted index of 500 stocks designed to measure performance of the broad domestic economy through changes in the aggregate market value of 500 stocks representing all major industries.
MSCI ACWI INDEX
The MSCI ACWI captures large- and mid-cap representation across 23 developed markets (DM) and 23 emerging markets (EM) countries*. With 2,480 constituents, the index covers approximately 85% of the global investable equity opportunity set.
Bloomberg U.S. Aggregate Bond Index
The Bloomberg U.S. Aggregate Bond Index is an index of the U.S. investment-grade fixed-rate bond market, including both government and corporate bonds.
https://www.bls.gov/news.release/jolts.htm
https://www.bls.gov/news.release/pdf/cpi.pdf
https://www.globaltimes.cn/page/202108/1230927.shtml
Compliance Case # 01107843


