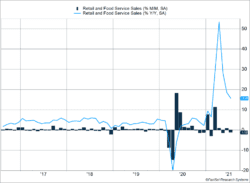
The benefits provided by recent stimulus packages seem to be fading. U.S. retail sales dipped 1.1% last month and have now declined in two of the last three months [Figure 1]. Declines in motor vehicle and online purchases led the fall. Restaurant sales grew 1.7% in July and continue to rebound. Federal Reserve minutes indicated the economy looks strong enough for the central bank to taper bond purchases in coming months.
Key Points for the Week
- The S&P 500 doubled its pandemic low after just 354 trading days.
- U.S. retail sales fell 1.1% last month, lagging expectations for a lesser decline of 0.3%.
- Chinese retail sales also missed expectations, rising 8.5% over the last year.
China’s economy seems to be slowing under the pressure of resurgent COVID cases and increased costs. Chinese retail sales rose 8.5% but missed economists’ expectations for 10.5% growth. Industrial production also missed expectations, rising 6.4%.
The S&P 500, without dividends, doubled from the COVID lows in March of last year, based on Monday’s close. Typically, the market takes 1,000 trading days to double from a low. The bottom on March 23, 2020, was surpassed in only 354 trading days.
After doubling the COVID low on Monday, stocks retreated. The S&P 500 shed 0.5%. Global stocks fared worse as the MSCI ACWI sagged 1.8%. The Bloomberg BarCap Aggregate Bond Index added 0.2%. U.S. home sales and core PCE inflation head the list of key economic data reporting this week.
Figure 1
Bouncing Back a Little Slower
The U.S. economy continues to make a slightly bumpy transition from COVID-led stimulus to a self-sustained reopening. The bumpiness popped up again this week as retail sales missed expectations of -0.3% and instead declined 1.1% [Figure 1].
The underlying data was even more bumpy. On the positive side, restaurants added another 1.7% in growth last month and sales have risen 38.4% during the last year. Gas station sales benefited from higher prices, and sales rose 3.5% in July. Gas sales have increased 37.5% during the last year. Negative contributors were led by motor vehicle and parts dealers, which experienced a 3.9% decline as the microchip shortage continues to plague auto dealers.
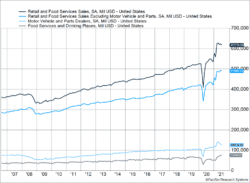
Figure 2 shows concerns about the decline in retail sales may be overdone. The top dark line shows retail sales climbed steadily until the pandemic started. After a sharp decline, sales have rebounded and are above the trend in earlier years. So, even though sales are falling, the absolute level implies the economy continues to make up for transactions lost during the pandemic.
Figure 2
Figure 2 also shows some other important trends. The second line from the top excludes sales of motor vehicles and parts. The decline in sales was much smaller if the industry most affected by the microchip shortage is excluded. As additional chips are manufactured, vehicle buyers are likely to make up for missed purchases.
Sales data will also be bumpy as consumers remain worried about the risks of venturing out. The Delta variant is likely to pressure sales in August. Increased social distancing will put additional pressure on sales at the same time as efforts are made to ramp up new car production.
As long as retail sales growth continues to be above the previous trend, our expectation is the market will perceive the economic recovery to be on solid ground. Some economists seem to have high expectations for the economic support provided millions of Americans to be self-reinforcing and kick growth to high levels. Our expectation was the economy would benefit from the stimulus, but those gains are likely to slow as stimulus support gets more distant each day. The priority remains making it safe for consumers to venture out and for workers to return to work.
—
This newsletter was written and produced by CWM, LLC. Content in this material is for general information only and not intended to provide specific advice or recommendations for any individual. All performance referenced is historical and is no guarantee of future results. All indices are unmanaged and may not be invested into directly. The views stated in this letter are not necessarily the opinion of any other named entity and should not be construed directly or indirectly as an offer to buy or sell any securities mentioned herein. Due to volatility within the markets mentioned, opinions are subject to change without notice. Information is based on sources believed to be reliable; however, their accuracy or completeness cannot be guaranteed. Past performance does not guarantee future results.
S&P 500 INDEX
The Standard & Poor’s 500 Index is a capitalization-weighted index of 500 stocks designed to measure performance of the broad domestic economy through changes in the aggregate market value of 500 stocks representing all major industries.
MSCI ACWI INDEX
The MSCI ACWI captures large- and mid-cap representation across 23 developed markets (DM) and 23 emerging markets (EM) countries*. With 2,480 constituents, the index covers approximately 85% of the global investable equity opportunity set.
Bloomberg U.S. Aggregate Bond Index
The Bloomberg U.S. Aggregate Bond Index is an index of the U.S. investment-grade fixed-rate bond market, including both government and corporate bonds.
https://www.census.gov/retail/marts/www/marts_current.pdf
https://www.cnbc.com/2021/08/18/fed-minutes-july.html
https://www.cnbc.com/2021/08/16/china-economy-retail-sales-slow-more-than-expected-in-july.html
Compliance Case # 01112714


